
Usage Guide
GuideCollecting uncore counters and running MESS memory analysis with Paraver
Collecting Uncore Counters for MESS on MN5
This guide applies to Extrae versions strictly later than 4.2.13 (i.e., 4.2.14 and above).
To collect uncore counters for MESS memory analysis, the typical launch script trace.sh used for setting LD_PRELOAD should no longer be used. Instead, utilize the new extrae-uncore script provided within the Extrae installation.
Extrae requires additional monitoring processes to collect uncore counters. Users must ensure that these monitoring processes are accounted for when allocating resources.
Adjust your SLURM job script and the Extrae configuration to incorporate the new launcher, following the steps below:
1. Modify the extrae.xml Configuration
Enable monitoring of uncore counters and specify which counters to measure:
<counters enabled="yes">
  <cpu ...
  </cpu>
  <uncore enabled="yes" period="10m">
    UNC_M_CAS_COUNT:RD, UNC_M_CAS_COUNT:WR
  </uncore>
  ...
</counters>
The tool expands base counters such as UNC_M_CAS_COUNT:RD and UNC_M_CAS_COUNT:WR into fully qualified counters to measure memory reads and writes across all IMC memory channels (imc0..imc7) and sockets in the node (2), e.g., spr_unc_imc[0-7]::UNC_M_CAS_COUNT:[RD|WR]:cpu=[0|56]. The complete list of counters (32 in MN5) is then used to automatically generate the counter set specification for the Extrae configuration file (4 sets of 8 counters each).
Counter Ordering Warning
The default alphabetical ordering can interleave RD and WR counters within the same set, which often causes random errors with PAPI during execution:
Extrae: Error! Hardware counter spr_unc_imc0::UNC_M_CAS_COUNT:RD:cpu=56 (0x4000001e) cannot be added in set 1 (task 3, thread 0)
PAPI error -8: Event exists, but cannot be counted due to hardware resource limits
To prevent these errors, the sorting has been changed to group counters by their event qualifier (i.e., the second-to-left token, such as RD or WR), and then sort each group alphabetically. This ensures that all counters within a set share the same event qualifier (RD or WR), completely eliminating the PAPI errors during execution. See MR #25 for details.
Alternate method: provide the fully-qualified counter list manually
If the automatic expansion of the counter list and assignment to sets results in incompatible configurations that cause PAPI errors, an option has been added to bypass this automatic process. Users can now manually specify the counter sets by creating a file with the following structure: each line represents a counter set. Limit each set to a maximum of 8 counters, and ensure that RD and WR counters are placed in separate sets to avoid conflicts:
> cat uncore-counters-for-mess-mn5.lst

spr_unc_imc0::UNC_M_CAS_COUNT:RD:cpu=0,spr_unc_imc0::UNC_M_CAS_COUNT:RD:cpu=56,spr_unc_imc1::UNC_M_CAS_COUNT:RD:cpu=0,spr_unc_imc1::UNC_M_CAS_COUNT:RD:cpu=56,spr_unc_imc2::UNC_M_CAS_COUNT:RD:cpu=0,spr_unc_imc2::UNC_M_CAS_COUNT:RD:cpu=56,spr_unc_imc3::UNC_M_CAS_COUNT:RD:cpu=0,spr_unc_imc3::UNC_M_CAS_COUNT:RD:cpu=56

spr_unc_imc4::UNC_M_CAS_COUNT:RD:cpu=0,spr_unc_imc4::UNC_M_CAS_COUNT:RD:cpu=56,spr_unc_imc5::UNC_M_CAS_COUNT:RD:cpu=0,spr_unc_imc5::UNC_M_CAS_COUNT:RD:cpu=56,spr_unc_imc6::UNC_M_CAS_COUNT:RD:cpu=0,spr_unc_imc6::UNC_M_CAS_COUNT:RD:cpu=56,spr_unc_imc7::UNC_M_CAS_COUNT:RD:cpu=0,spr_unc_imc7::UNC_M_CAS_COUNT:RD:cpu=56

spr_unc_imc0::UNC_M_CAS_COUNT:WR:cpu=0,spr_unc_imc0::UNC_M_CAS_COUNT:WR:cpu=56,spr_unc_imc1::UNC_M_CAS_COUNT:WR:cpu=0,spr_unc_imc1::UNC_M_CAS_COUNT:WR:cpu=56,spr_unc_imc2::UNC_M_CAS_COUNT:WR:cpu=0,spr_unc_imc2::UNC_M_CAS_COUNT:WR:cpu=56,spr_unc_imc3::UNC_M_CAS_COUNT:WR:cpu=0,spr_unc_imc3::UNC_M_CAS_COUNT:WR:cpu=56

spr_unc_imc4::UNC_M_CAS_COUNT:WR:cpu=0,spr_unc_imc4::UNC_M_CAS_COUNT:WR:cpu=56,spr_unc_imc5::UNC_M_CAS_COUNT:WR:cpu=0,spr_unc_imc5::UNC_M_CAS_COUNT:WR:cpu=56,spr_unc_imc6::UNC_M_CAS_COUNT:WR:cpu=0,spr_unc_imc6::UNC_M_CAS_COUNT:WR:cpu=56,spr_unc_imc7::UNC_M_CAS_COUNT:WR:cpu=0,spr_unc_imc7::UNC_M_CAS_COUNT:WR:cpu=56
To use a manually defined counter list, add the --no-detect ./uncore-counters-for-mess-mn5.lst flag to the extrae-uncore command in step 4.
2. Extend the SLURM Allocation
In addition to the processes used by the application (<APP_PROCS>), it is necessary to allocate extra monitoring processes (<MONITOR_PROCS>). For MESS memory analysis on MN5, this requires 4 additional processes per node (corresponding to the 4 counter sets needed to cover all 32 counters).
In the general case, users can run the extrae-uncore tool with the --dry-run flag to estimate the number of additional processes required:
${EXTRAE_HOME}/bin/extrae-uncore --dry-run <extrae_xml_config_file> <extrae_tracing_library.so> <app_binary>

Extrae: Will need <MONITOR_PROCS> processes/node to measure uncore counters
Add the number of extra processes reported (<MONITOR_PROCS>) to the --ntasks constraint in your SLURM job script. You should also modify the srun command to explicitly specify the number of application processes using the -n flag. Keep in mind that <MONITOR_PROCS> is the number of extra processes per node, so be sure to scale accordingly:
#SBATCH --ntasks=<APP_PROCS>+<MONITORS_PROCS>
...
srun -n <APP_PROCS> ...
For MN5 specifically, 4 monitoring processes per node are required.
3. Set Environment Variables for MPI_Comm_spawn
If the application uses MPI, the following environment variables must be set to allow Extrae to create monitoring processes using MPI_Comm_spawn:
export SLURM_EXACT=1
export SLURM_MEM_PER_CPU=7200
export SLURM_OVERCOMMIT=1
Additionally, if you are using the Intel MPI communication libraries, you must also set:
export I_MPI_SPAWN=onThese settings ensure that SLURM allocates resources correctly and that the MPI runtime allows dynamic process creation for monitoring.
4. Replace trace.sh with extrae-uncore
The usual command to run a traced MPI application:
srun ./trace.sh ./xhpcg_avx512 -n 20 --rt 10Is replaced by:
srun -n APP_PROCS $EXTRAE_HOME/bin/extrae-uncore ./extrae.xml libmpitrace.so ./xhpcg_avx512 -n 20 --rt 10In this command:
- The
-nflag specifies the number of application processes. Monitoring processes are managed separately byextrae-uncore. trace.shis replaced byextrae-uncore- The arguments to
extrae-uncoreare:./extrae.xml: the Extrae configuration file.libmpitrace.so: the tracing library to preload.- The application binary (
./xhpcg_avx512) followed by its arguments (-n 20 --rt 10)
Make sure the total number of allocated tasks (--ntasks) in your SLURM script accounts for both application and monitoring processes.
5. Full Example Job Script (HPCG Benchmark)
#!/usr/bin/env bash

#SBATCH --job-name=xhpcg_mpi
#SBATCH -D .
#SBATCH --output=%x_%j.out
#SBATCH --error=%x_%j.err
#SBATCH --nodes=1
#SBATCH --ntasks=112
#SBATCH --cpus-per-task=1
#SBATCH --ntasks-per-node=112
#SBATCH --time=00:05:00
#SBATCH --account=bsc41
#SBATCH --qos=gp_debug
#SBATCH --exclusive
#SBATCH --constraint=perfparanoid

module load extrae

export SLURM_EXACT=1
export SLURM_MEM_PER_CPU=7200
export SLURM_OVERCOMMIT=1
export I_MPI_SPAWN=on

export OMP_NUM_THREADS=1

srun -n 108 $EXTRAE_HOME/bin/extrae-uncore ./extrae.xml libmpitrace.so ./xhpcg_avx512 -n 20 --rt 10
Running MESS Analysis from Paraver
A working installation of MESS is required to run this analysis. Make sure the executable mess-prv is in the PATH. See How to install MESS below for details.
MESS was recently renamed from PROFET, so you may still encounter references to the old name.
With a trace already loaded containing uncore memory counters data, and a timeline view optionally zoomed on any particular interval of interest, the user needs to:
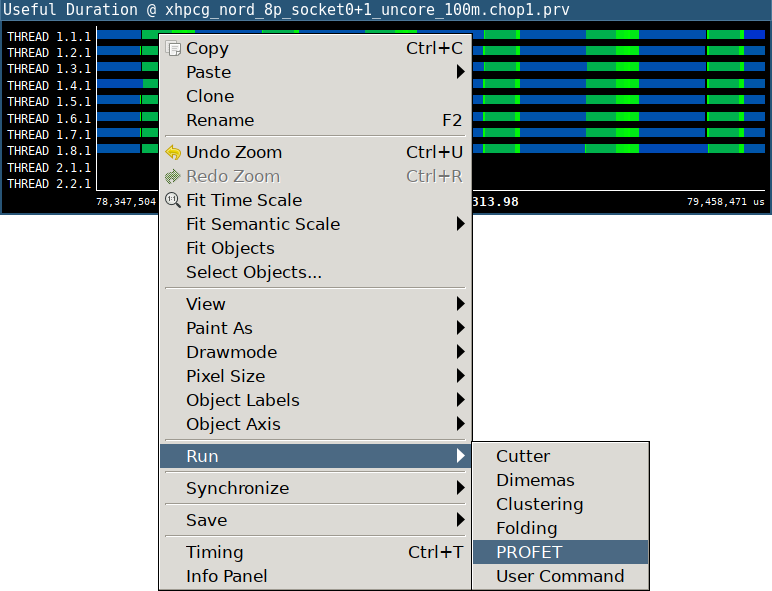
1. Open the MESS analysis
Right click on the timeline to open the context menu, select "Run → MESS":
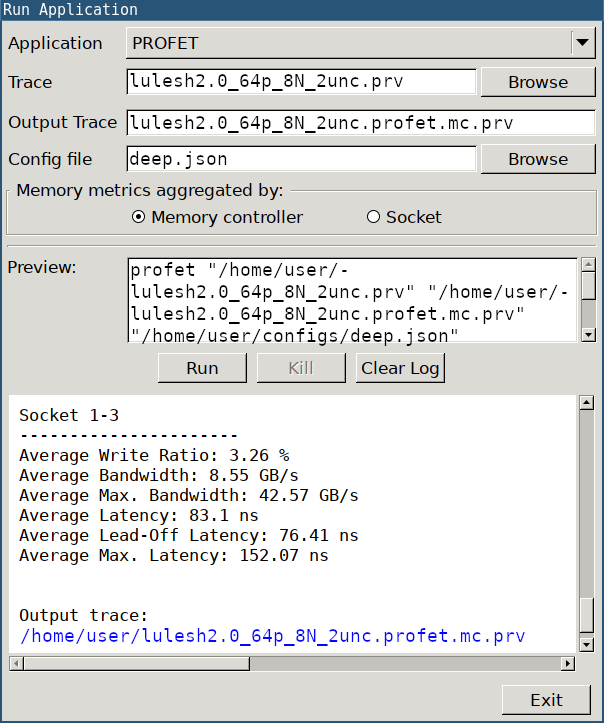
2. Configure the analysis
In the new dialog, configure the settings by selecting the architecture configuration file (Config file). Configuration files for several architectures are distributed with MESS source code, under the folder "configs".
Example of MESS config file tuned for MN5-GPP:
{
    "memory_system": "ddr5_4800",
    "cpu_model": "xeon_platinum_8480",
    "cpu_freq_ghz": 2,
    "cache_line_bytes": 64
}
3. Run the analysis
Click on "Run" to start the analysis, the output will be written on the bottom text box. The blue hyperlink for "Output trace" is clickable and automatically loads the new trace with MESS memory metrics. Another hyperlink for "Dash" brings up an interactive dashboard in the web browser displaying summary statistics and charts illustrating the stress levels of various memory devices.
4. Load Paraver configuration
Load the Paraver configuration file from:
- Hints → PROFET (suggested views)
- File → Load Configuration → cfgs/PROFET/mess_all_metrics.cfg (all available views)
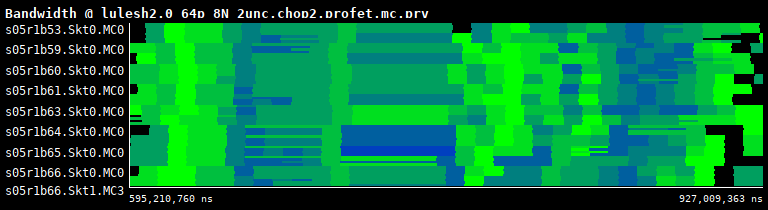
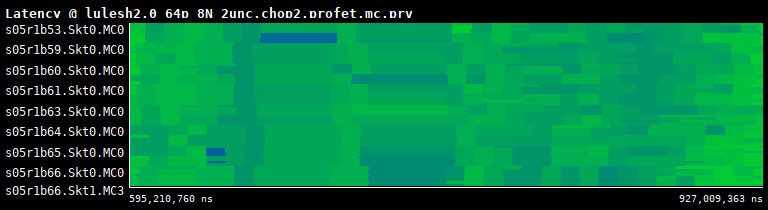
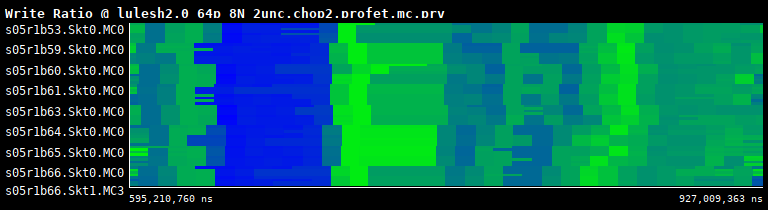
These configurations open timeline views showing Bandwidth, Latency and Read/Write Ratio metrics:
Bandwidth per IMC
Latency per IMC
Read/Write ratio per IMC
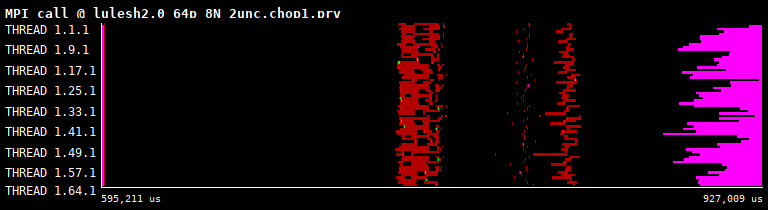
These can be correlated with the application's activity (e.g., Hints → Useful → Useful duration, Hints → MPI → MPI calls):
Computation duration
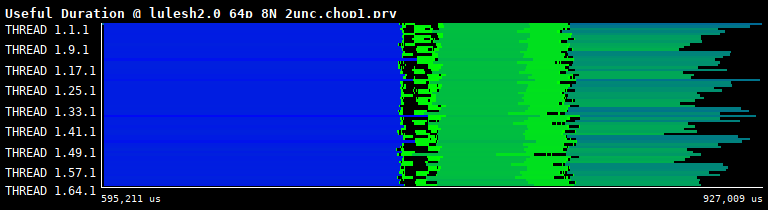
MPI calls
Annex: How to Install MESS
git clone --recurse-submodules https://github.com/bsc-mem/Mess-Paraver.git
cd Mess-Paraver
python -m venv venv
source ./venv/bin/activate
make
At this point, you should see the binary ./bin/mess-prv.
Before running Paraver, add <mess-root-path>/bin to your PATH so the mess-prv executable can be found:
export PATH=<mess-root-path>/bin:$PATH