
Lecture 2: Rooflines, Caches, and Why "Peak FLOPs" Rarely Tells the Whole Story
Rooflines, caches, and why peak FLOPs rarely tells the whole story: Aleksandar Ilic, Alexandre Rodrigues and Leonel Sousa explore the Cache-Aware Roofline Model and application optimization.

Authors: Aleksandar Ilic, Alexandre Rodrigues and Leonel Sousa
If you have ever benchmarked some code and got a number that simply doesn't make sense - much lower than the CPU's advertised peak, or almost unchanged no matter what you try - you have probably hit the same problem we all face in HPC: very often, the compute units are not the real limitation - the memory system is.
This is basically what the Roofline model is about, and it was also one of the topics of the "It's Memory, Stupid!" workshop [1] that INESC-ID partner delivered, together with Intel Corporation and hosted by BSC.
The original Roofline model [2] plots performance (flops/s) against arithmetic intensity (flops per byte moved). It then gives you a roof based on the maximum compute performance and memory bandwidth of the machine. It is a very simple model, which is probably one of the reasons why it became so popular and is still widely used.
But the original model is not without its flaws - bandwidth is normally considered between memory levels: L2↔L1, L3↔L2, DRAM↔L3, etc. So, depending on which cache level you are looking at, the same application can end up being represented by different points and different roofs. And, of course, those roofs are based on bandwidth values that the application may not actually exercise.
This is one of the things we sought to address with the Cache-Aware Roofline Model (CARM) [3], which we started working on more than a decade ago. Instead of looking at the theoretical bandwidth between memory levels, CARM measures the bandwidth as seen by the core, using micro-benchmarks. This gives a somewhat different picture of the machine than simply taking numbers from a datasheet.
More importantly, the application becomes a single point with a single arithmetic intensity, which can then be compared against all the different cache/memory roofs. This makes it much easier to see where the application is actually limited: memory, compute, or somewhere in between - and, in the memory-bound case, which level of the memory hierarchy is causing the problem.
During the session we showed this using a very classical example: naïve matrix multiplication (DGEMM) using our CARM Tool [4,5]. Following the CARM insights, we applied several optimization steps that resulted in a 166x speedup on MareNostrum 5’s GPP Node with Intel Xeon Max 8480 processor. What is particularly good about CARM here is that it does not just tell you that the optimization worked. It helps explain why it worked and what was limiting the application before and after each step.
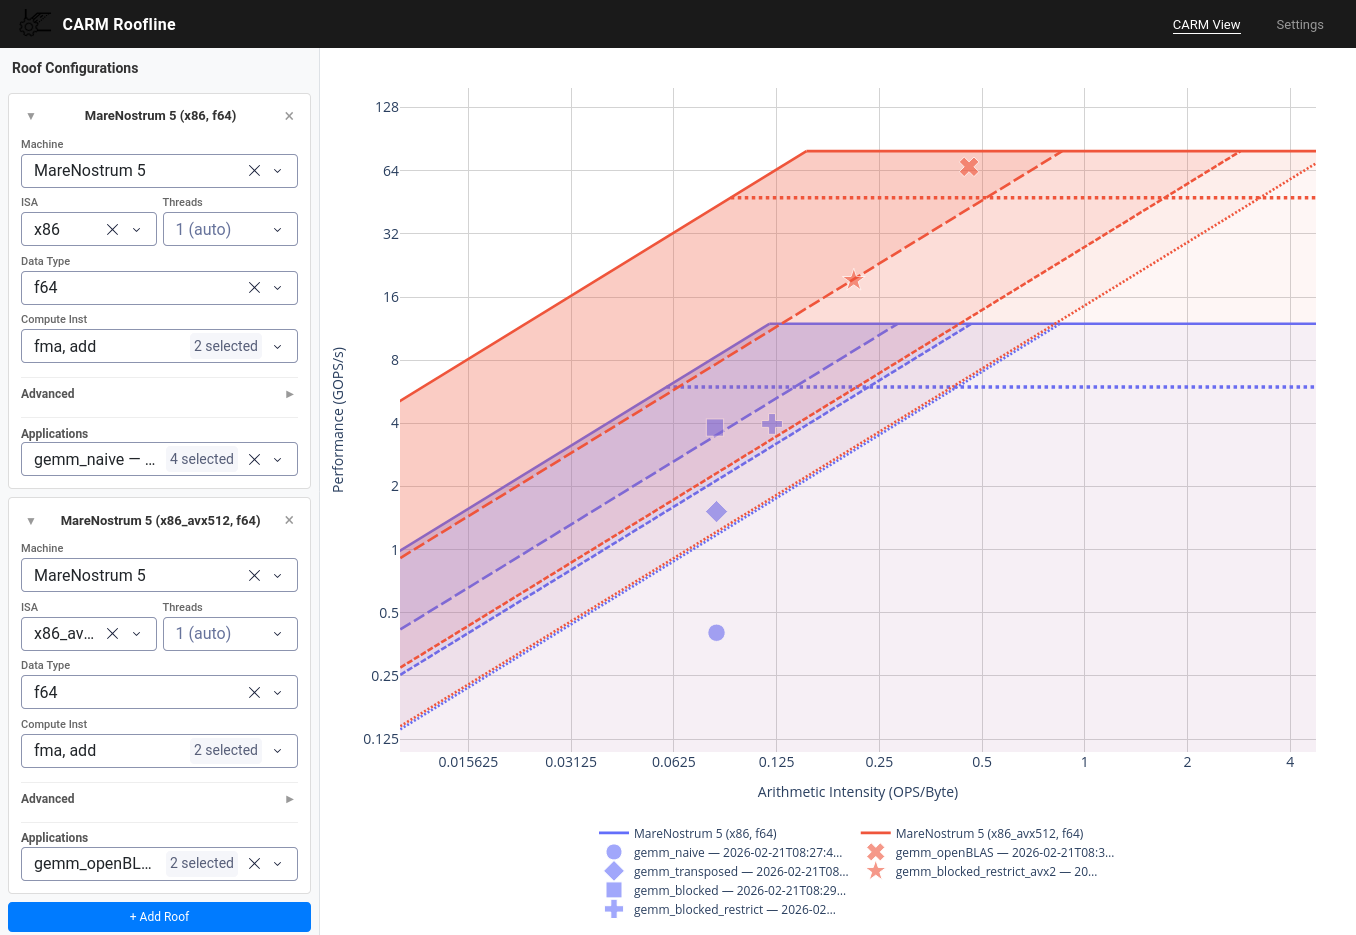
The CARM Tool [4,5] is open source and available both as a CLI and GUI. It supports Intel, AMD, ARM and RISC-V, and combines PMU-based profiling with dynamic binary instrumentation. It is already integrated into Intel Advisor and can also be connected to Paraver through Extrae traces when you want to look at the application timeline in more detail. We are also working on making it available across EuroHPC systems through the POP Centre of Excellence [6].
Within DARE SGA1 [7], we are using CARM in the RISC-V General Purpose Processor pathfinding work, a technical area led by Codasip. The idea is to use cache-aware application profiling to provide architecture-specific feedback on how applications actually use a new processor's memory hierarchy. In other words, instead of waiting for the hardware to exist and then discovering how applications behave on it, we can use applications to help guide the architecture decisions.
It is essentially the same question we have been asking for quite some time, going back to our work around CARM in 2014, but now applied to the next generation of European HPC hardware:
It is not really about the peak. The question is whether your application can actually get there, and how.
If you want to dig further, the CARM Tool is available on GitHub under the CHAMP hub [5], and the original CARM paper [3] and the CARM Tool paper [4] are linked in the session materials.
LINKS:
[1] “It’s memory, stupid!”, Workshop / Training Course, Barcelona Supercomputing Center . BSC, (2026), https://memory.bsc.es/training/its-the-memory-stupid
[2] Williams, Samuel, Andrew Waterman, and David Patterson. "Roofline: an insightful visual performance model for multicore architectures." Communications of the ACM 52.4 (2009): 65-76. https://doi.org/10.1145/1498765.1498785
[3] Ilic, Aleksandar, Frederico Pratas, and Leonel Sousa. "Cache-aware roofline model: Upgrading the loft." IEEE Computer Architecture Letters 13.1 (2013): 21-24. 10.1109/L-CA.2013.6
[4] Morgado, José, Leonel Sousa, and Aleksandar Ilic. "CARM tool: cache-aware roofline model automatic benchmarking and application analysis." 2024 IEEE International Symposium on Workload Characterization (IISWC). IEEE, 2024. 10.1109/IISWC63097.2024.00016
[5] The CARM Tool on Github, https://github.com/champ-hub/carm-roofline
[6] POP Centre of Excellence, https://pop-coe.eu
[7] DARE project: A new era for supercomputing in Europe, https://dare-riscv.eu