
Lecture 3: Memory system performance is Messy
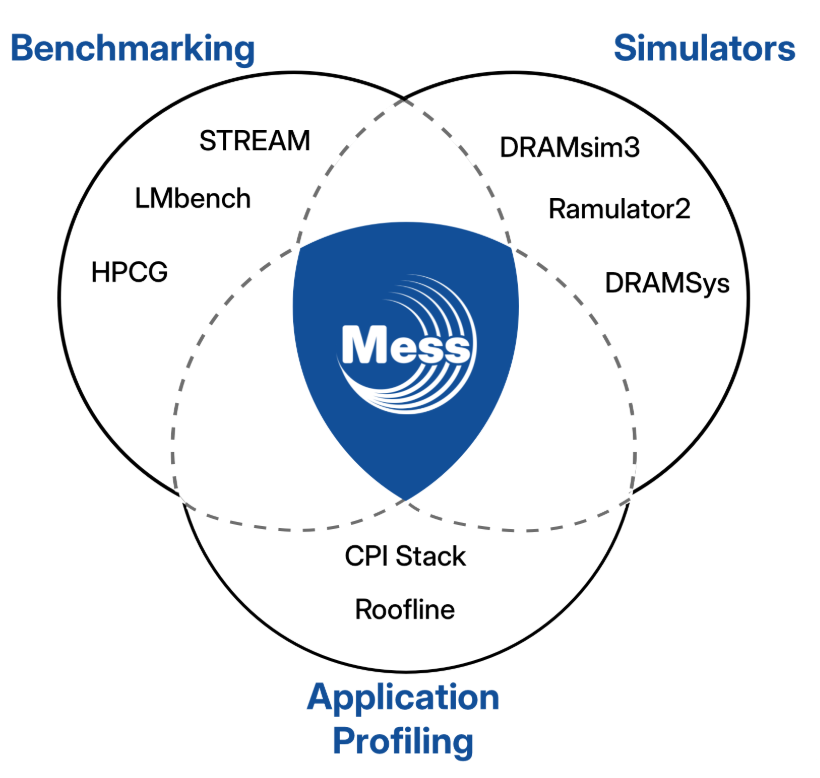
Mess connects memory benchmarking, simulation and application profiling through a unified view of memory-system performance: bandwidth–latency curves.
A server datasheet may tell us the maximum memory bandwidth of a system. A latency benchmark may give us a single number. An application profiler can tell us how much traffic a workload generates.
But do any of these measurements, by themselves, tell us what memory-system performance really looks like?
Not quite.
In the third lecture of It’s the Memory, Stupid!, we introduce Memory Stress (Mess) framework, developed at BSC to connect memory benchmarking, simulation and application profiling through a common view of memory-system performance.
Mess is based on two central ideas.
Idea 1 · Bandwidth–latency curves
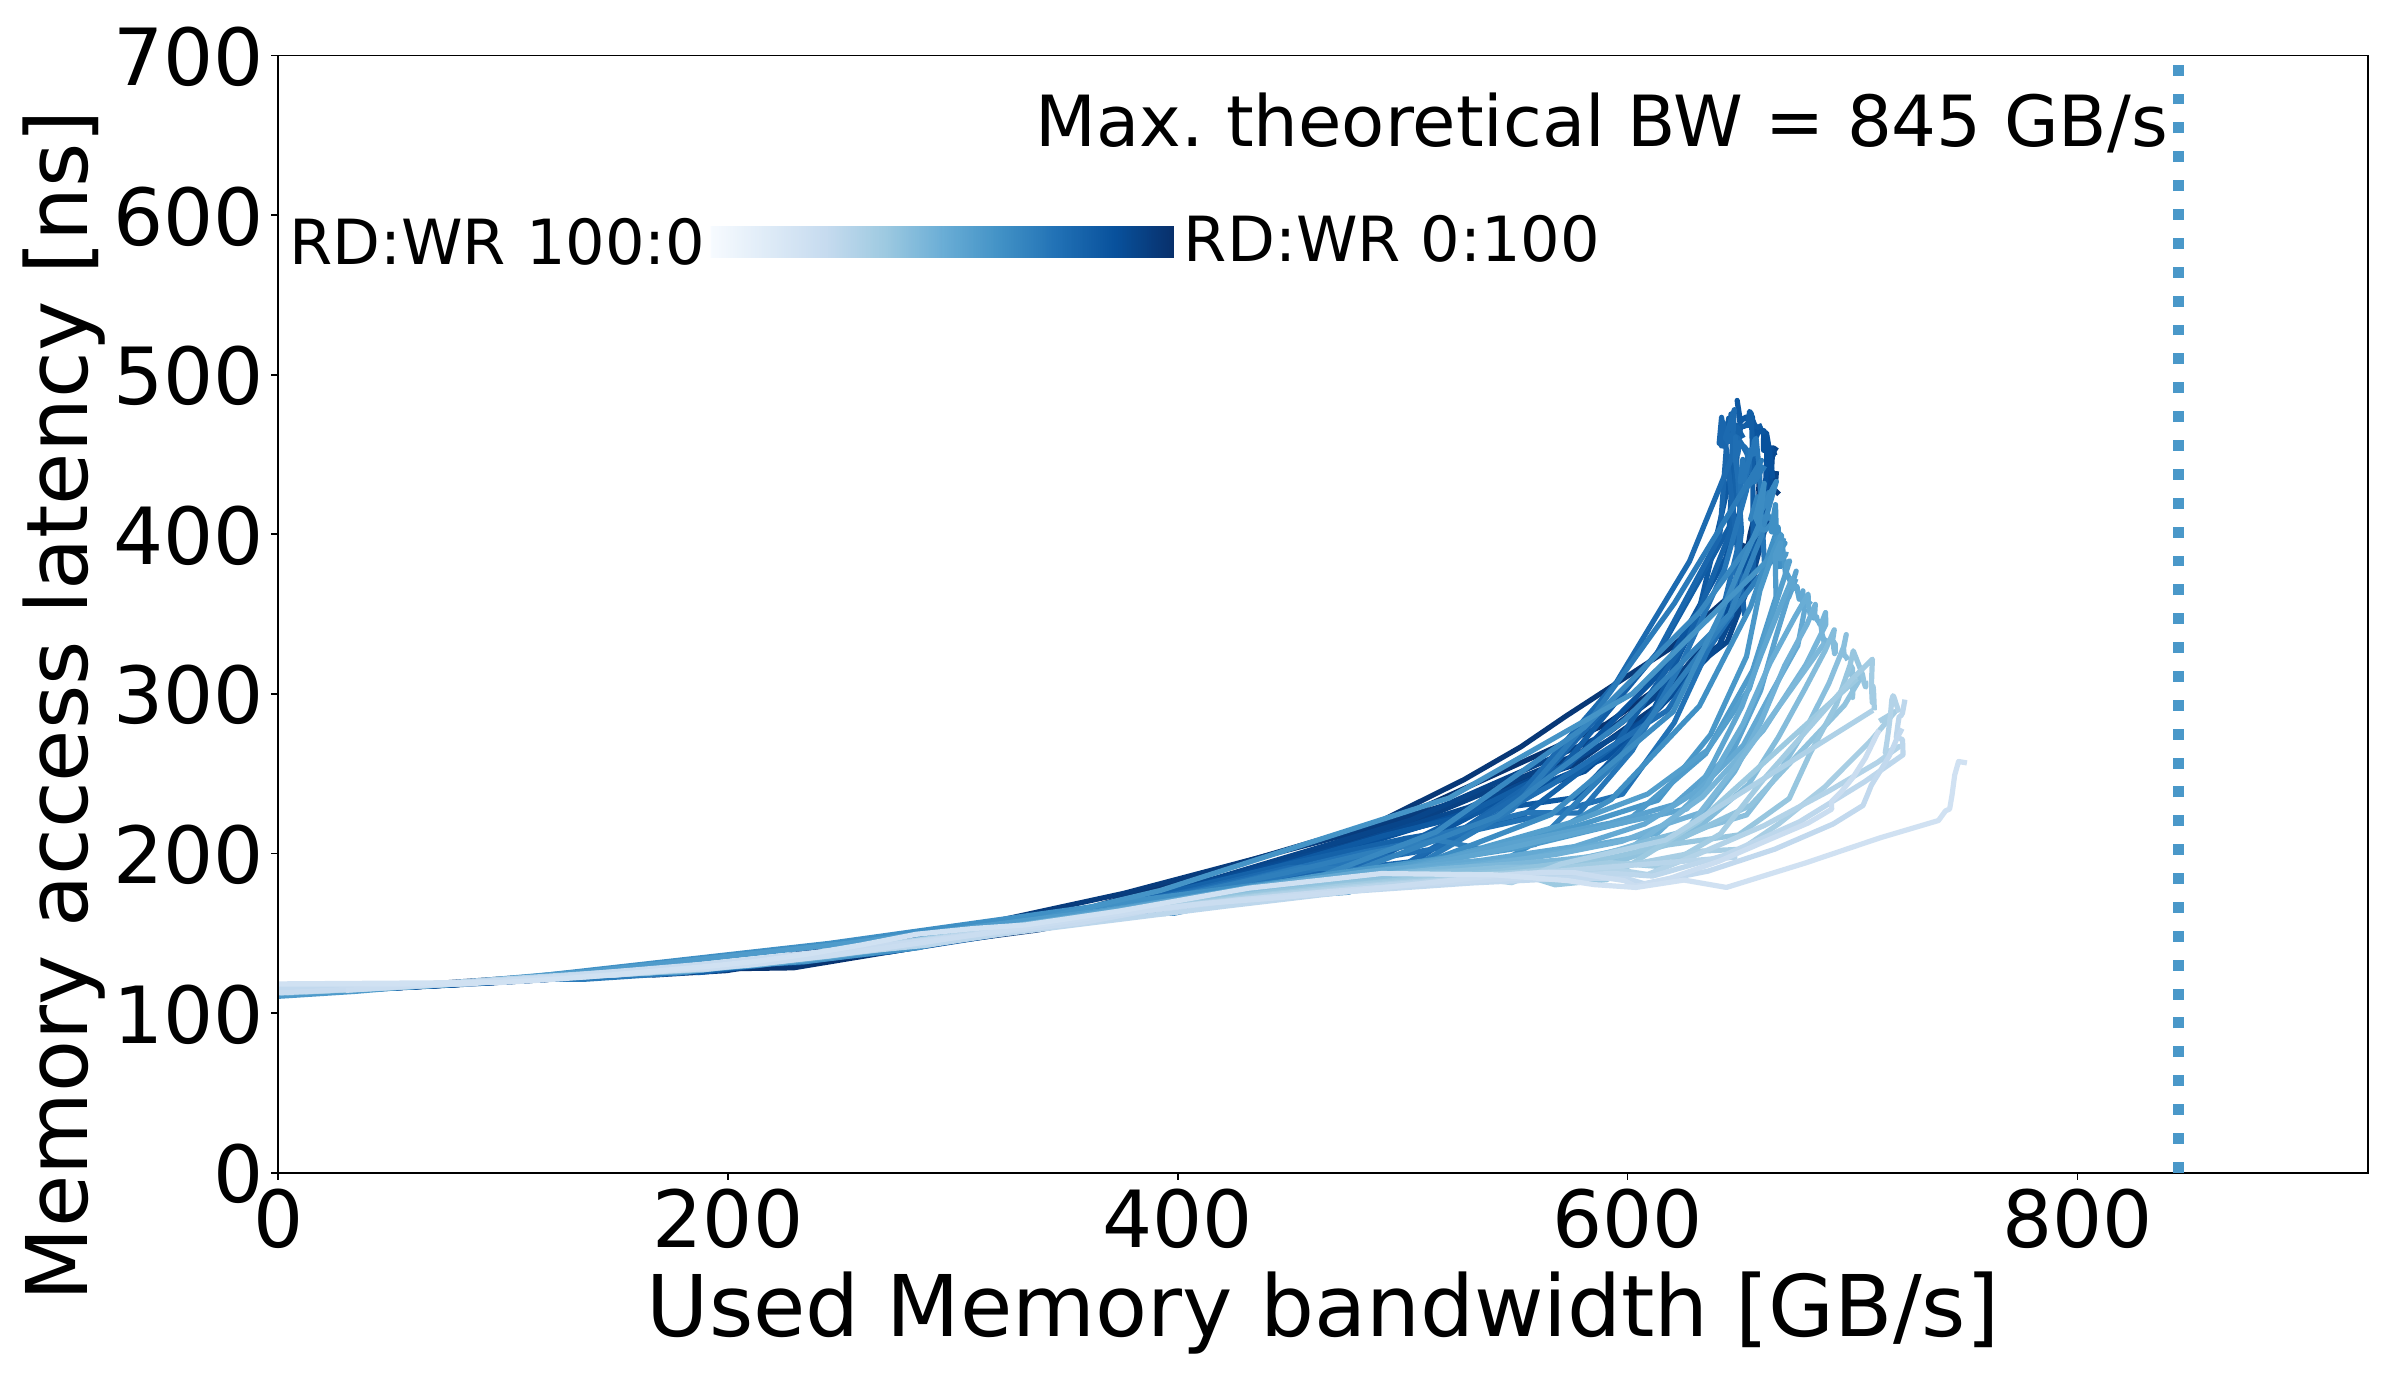
The first is that memory-system performance can, and should, be represented as a family of bandwidth–latency curves.
This performance view, provided by the Mess benchmark, covers the full range of memory traffic intensity, from an unloaded system to a fully saturated one, while also considering numerous combinations of read and write operations (see the figure below). Reducing memory performance to anything simpler than this leaves out important parts of the picture.
The Mess study has characterized systems ranging from conventional DDR4 and DDR5 servers to HBM-based platforms. The lecture extends that picture with newer technologies, including MRDIMMs, CXL memory expanders and NVIDIA Grace LPDDR5X. And more exotic memory technologies are on the way.
Idea 2 · Unified memory-performance view
The second idea is that memory-system benchmarking, simulation and application profiling can, and should, be based on a unified view of memory-system performance.
Mess provides that common view. Beyond benchmarking the memory system itself, the same bandwidth–latency curves can be used to enhance application performance profiling and analysis, and even for the memory-system simulation.
Where Does Your Application Sit?
Benchmarking the machine is only part of the story.
The next step is to profile an application’s memory read and write traffic using standard profiling tools and map those measurements onto the system's Mess curves. The result provides something very useful for the users: application memory behavior interpreted in the context of what the memory system can actually deliver.
This approach can also be combined with other performance analysis tools, allowing developers to identify periods of high memory stress over time and correlate them with application phases and source-level behavior.
DARE project
In the context of the DARE project, the Mess benchmark is used to validate memory-system performance across the different tools and platforms involved in the design flow, including hardware simulators, FPGA prototypes and post-silicon systems.
This provides a common performance reference across different stages of system development, making it possible to check whether the behavior observed in simulation and prototyping remains consistent with the final hardware.
One method. Many memory systems. Openly available.
The benchmark, collected platform results and visualization tools are openly available at the BSC Memory team repository, building on the work presented in A Mess of Memory System Benchmarking, Simulation and Application Profiling, which received the Best Paper Runner-Up Award at MICRO 2024.
Memory system performance is fun!
If you thought memory-system profiling was boring, take a look at the ongoing debate around the performance evaluation of memory simulators.